

Aggois: Last-Mile Financing for Small-Holder Farmers
Case
Teaching Notes
Supplementary Resources
Abstract
Procurement based on the MSP route provides an avenue of assured and stable returns to farmers. In an RBI survey conducted in 2018, more than 50% farmers identified “MSPs for crops” as the most helpful scheme. However, the delayed payments on the sold produce pose a challenge to the farmers who, faced with tight and limited budgets, seek immediate capital for their expenses and impending production cycle. To ease this burden, Aggois provides receivable financing to farmers for the produce sold at MSP. Aggois began with an experimental model in which they could help farmers get better prices for their produce by reducing the rejection rates from large buyers. While the pilot was successful, they decided to discontinue their operations and explore other ways of fulfilling their purpose, as (a) they wanted to work with farmers at the ground level, as compared with the current engagements with traders; and (b) poor experience with buyers with inconsistent policies. Field interactions with farmers brought to light their needs, challenges and aspirations, connected to their primary source of livelihood—agriculture. Some key constraints identified were—tight operating budgets, trade-off between price and timely payments, high interest rates on loans, lack of financial literacy and management skills and lack of access to storage and financial products. The team at Aggois decided to look at the problem of farmer financing—particularly, the lack of receivables financing, which left them no option but to choose between two bad alternatives i.e. high rates with delayed payments under MSP or prompt payments at lower rates in private transactions. The product was named RapidPay and the value proposition was two-fold: (1) Provide liquidity to farmers for their next crop immediately post-harvest; and (2) Make it economically beneficial by providing them the option to sell at MSP and get financing at much lower rates of interest than local moneylenders.
This case study is provided in this Sage Business collection primarily as a basis for classroom discussion or self-study and is not meant to illustrate either effective or ineffective management styles. Nothing herein shall be deemed to be an endorsement of any kind. This case study is for scholarly, educational, or personal use only within your university, and cannot be forwarded outside the university or used for other commercial purposes.
© 2026 Sage Publications, Inc. All Rights Reserved.
Resources
Exhibit 1: Farmer Profiles and Stories
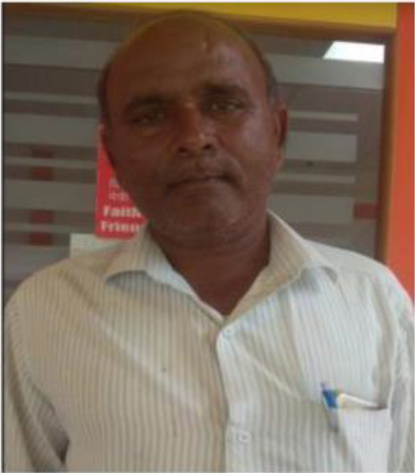
Arunkumar, aged 52 years, resides in Wacha village of district Gulbarga in the state of Karnataka with his family of three persons other than him. In March 2020, he received INR 37,000 as MSP-based receivable financing for his produce of red gram that resolved his need for money in crucial time. According to him, Aggois’ loan facility should be extended for other crops as well, such as sorghum and sunflower.
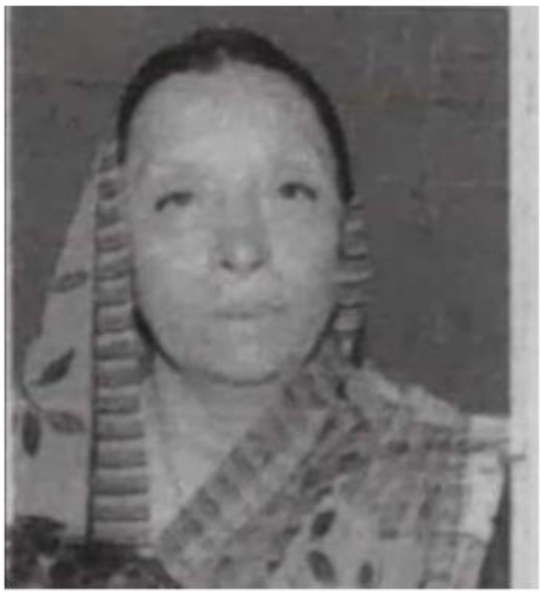
Shardabai Patil, aged 75, is a resident of Malaghan village and lives with a family of five. She received loans of INR 22,000 and INR 37,000 respectively in November 2019 and March 2020 respectively. She feels grateful that she was able to get the loan urgently in her moment of need.
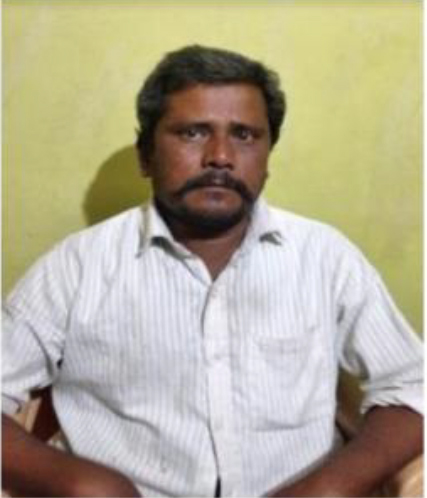
Jagannath, aged 32 years, is a resident of Hebbal village and received a loan amount of INR 30,500 and INR 37,000 in November 2019 and March 2020 respectively. The loan facility extended by Aggois resolved the money problem he had been facing.
He felt that similar loan facilities could be extended for inputs and resources such as chemical, fertilizer, land and for related non-farm activities such as retail and producer groups.
| Exhibit 2 Comparison of MSP Price with Market Price | |||||
|---|---|---|---|---|---|
Crop | Region | Year | Market rate in Rs/Qtl (Minimum) | Market rate in Rs/Qtl (Maximum) | MSP Rate in Rs/Qtl |
Tuar | Karnataka | 2021 | 4807 | 6659 | 6000 |
Pulses | India | 2021 | 5400 | 5500 | 6200 |
Paddy | Bihar | 2020 | 800 | 1200 | 1868 |
The government makes procurement for one-third of the commodities under MSP, that is currently limited to 23 farm commodities
|
Source: The above data is based on information from multiple sources as provided in the footnote20
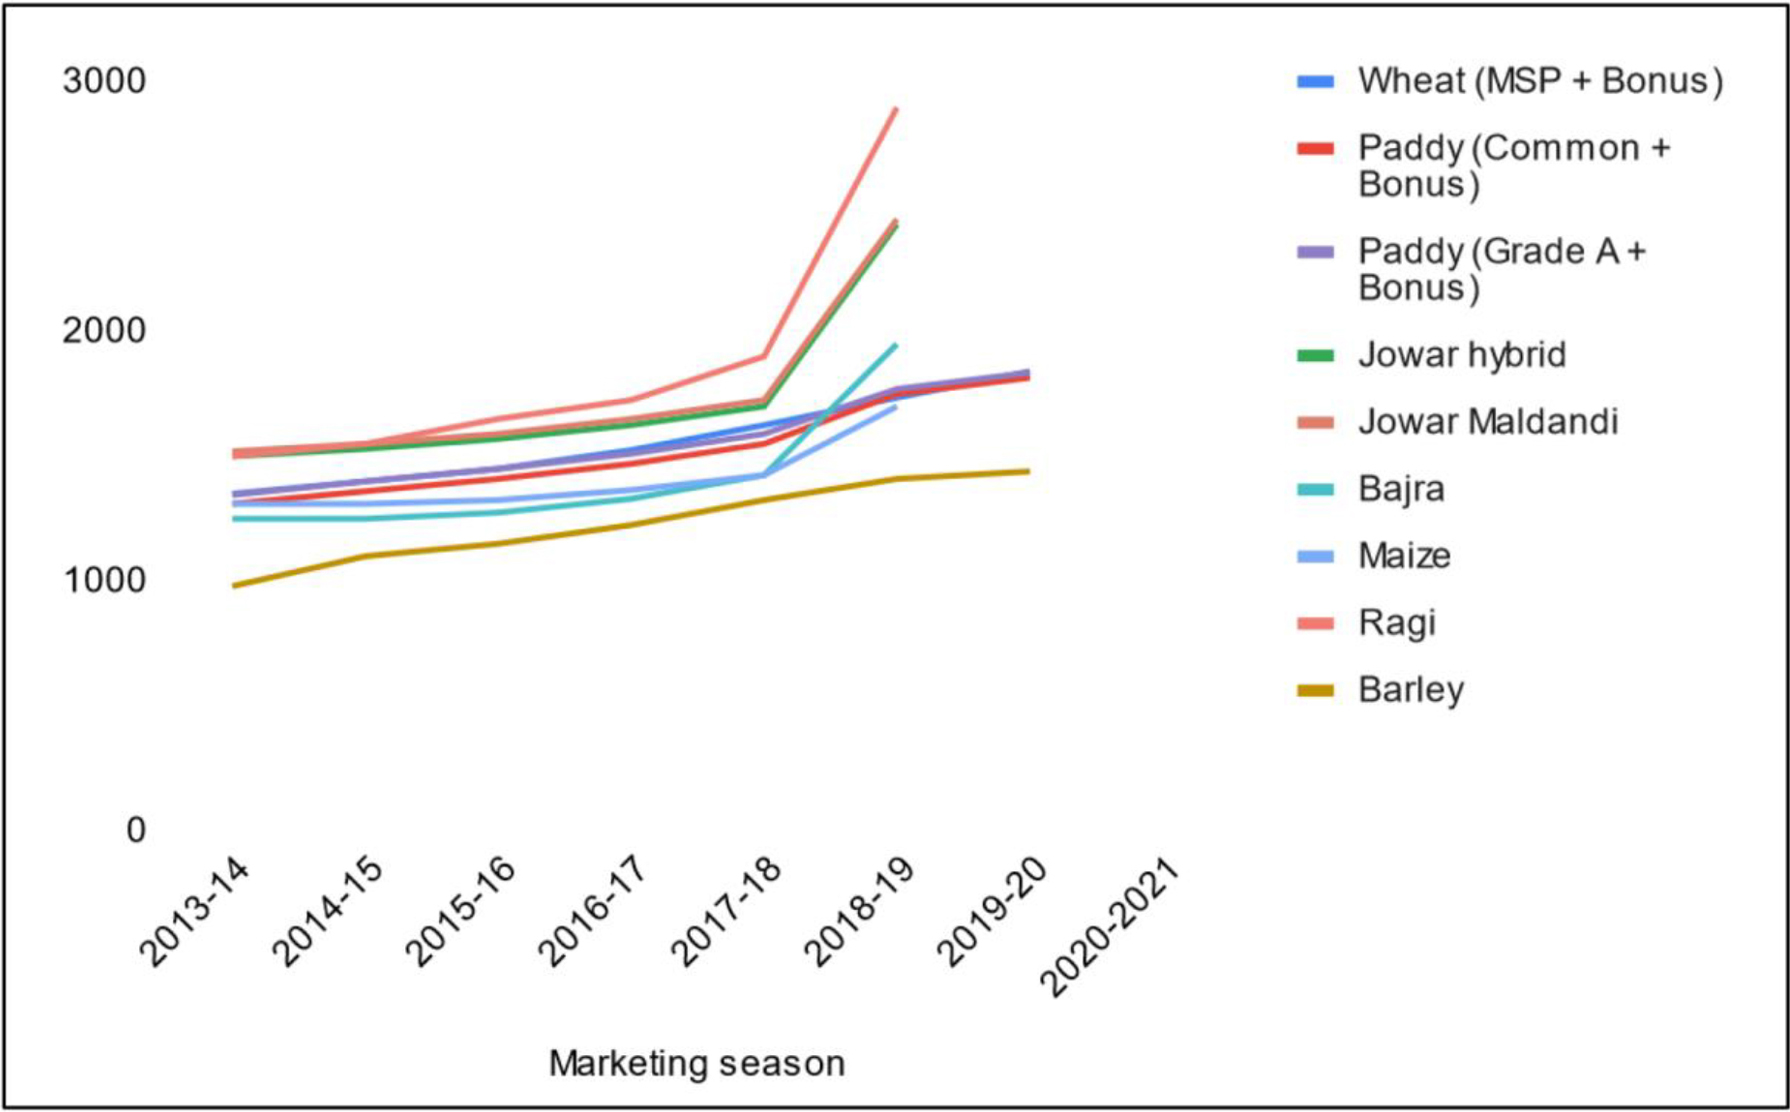
The horizontal axis shows marketing seasons from 2013–14 to 2020–21 and the vertical axis shows MSP prices from 0 to 3000 in increments of 1000. Approximate data corresponding to MSP prices for different food grains over time is as follows:
Barley: 2013–14: 980; 2014–15: 1100; 2015–16: 1150; 2016–17: 1225; 2017–18: 1325; 2018–19: 1410; 2019–20: 1440.
Ragi: 2013–14: 1500; 2014–15: 1550; 2015–16: 1650; 2016–17: 1725; 2017–18: 1900; 2018–19: 2897; 2019–20: N/A.
Maize: 2013–14: 1310; 2014–15: 1310; 2015–16: 1325; 2016–17: 1365; 2017–18: 1425; 2018–19: 1700; 2019–20: N/A.
Bajra: 2013–14: 1250; 2014–15: 1250; 2015–16: 1275; 2016–17: 1330; 2017–18: 1425; 2018–19: 1950; 2019–20: N/A.
Jowar Maldandi: 2013–14: 1520; 2014–15: 1550; 2015–16: 1590; 2016–17: 1650; 2017–18: 1725; 2018–19: 2450; 2019–20: N/A.
Jowar Hybrid: 2013–14: 1500; 2014–15: 1530; 2015–16: 1570; 2016–17: 1625; 2017–18: 1700; 2018–19: 2430; 2019–20: N/A.
Paddy (Grade A plus bonus): 2013–14: 1345; 2014–15: 1400; 2015–16: 1450; 2016–17: 1510; 2017–18: 1590; 2018–19: 1770; 2019–20: 1835.
Paddy (Common plus bonus): 2013–14: 1310; 2014–15: 1360; 2015–16: 1410; 2016–17: 1470; 2017–18: 1550; 2018–19: 1750; 2019–20: 1815.
Wheat (MSP plus bonus): 2013–14: 1350; 2014–15: 1400; 2015–16: 1450; 2016–17: 1525; 2017–18: 1625; 2018–19: 1735; 2019–20: 1840
Exhibit 3: Year Wise Trends in MSP Prices for Different Agricultural Commodities (Food-grains)
Source: The data was taken from ‘Minimum Support Price of Foodgrains’ by Department of Food and Public Distribution21
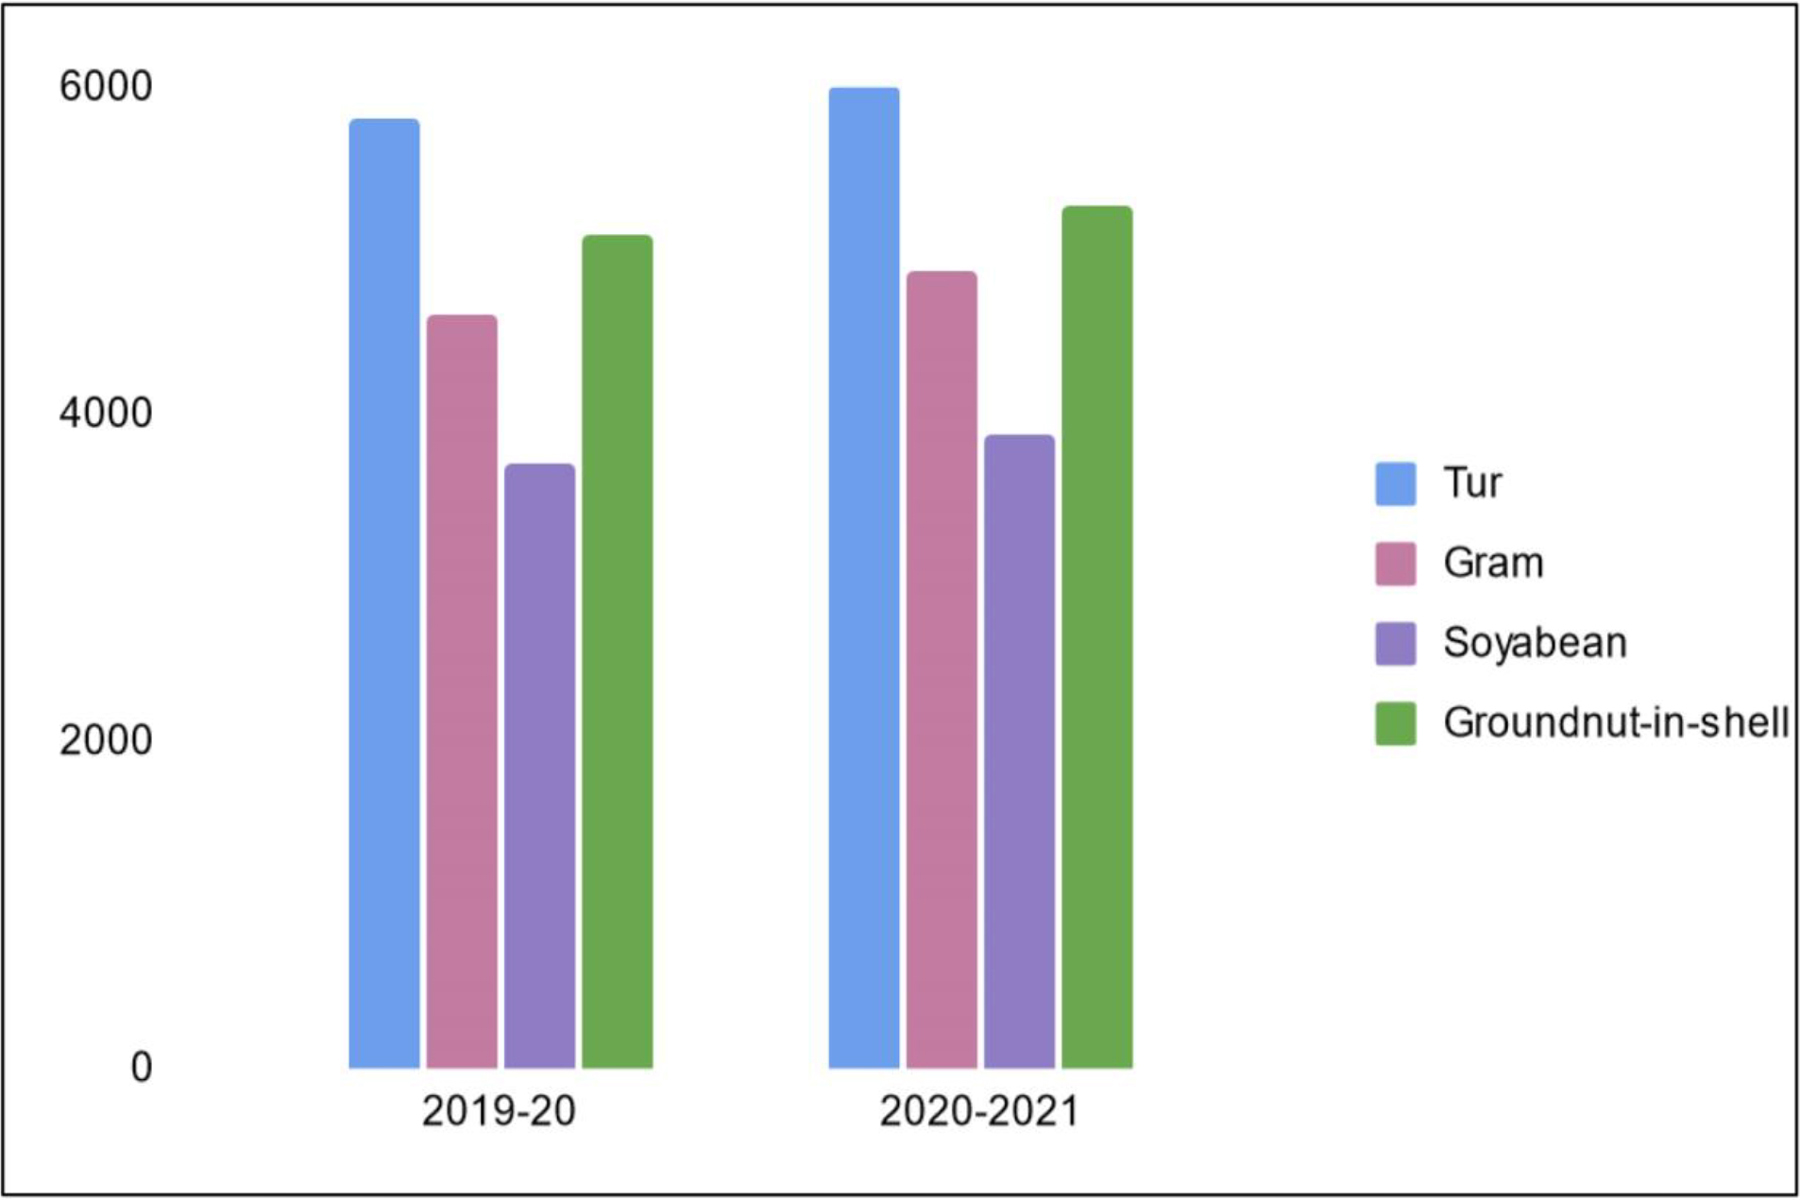
The horizontal axis shows the years 2010–20 and 2020–2021. The vertical axis shows MSP prices from 0 to 6000 in increments of 2000. Approximate data corresponding to the trends in MSP for Tur, Gram, Soyabean, and Groundnut-in-shell during 2019–20 and 2020–21 is as follows:
Tur: 2019–20: 5800; 2020–2021: 6000.
Gram: 2019–20: 4620; 2020–2021: 4875.
Soyabean: 2019–20: 3710; 2020–2021: 3880.
Groundnut-in-shell: 2019–20: 5090; 2020–2021: 5275
Exhibit 4: Past Two Year Trends in MSP for Pulses and Oilseeds
Source: The data was taken from ‘Annual Report (2019–20) by NAFED22
| Exhibit 5 MSP Based Procurement by NAFED - Timeline for Procurement of Kharif Crops in the State of Karnataka | ||||||
|---|---|---|---|---|---|---|
Crop | Period of Harvesting | Period of MSP Announcement | Period of Actual procurement | Quantity (MT) procured | ||
Tuar | November/December | January | April | January | April | 110,610.8 |
Moong | August/September | August | November | September | October | 28,950 |
Urad | August/September | October | January | December | December | 10.10 |
Source: The above information is based on Aggois’ desk and field research
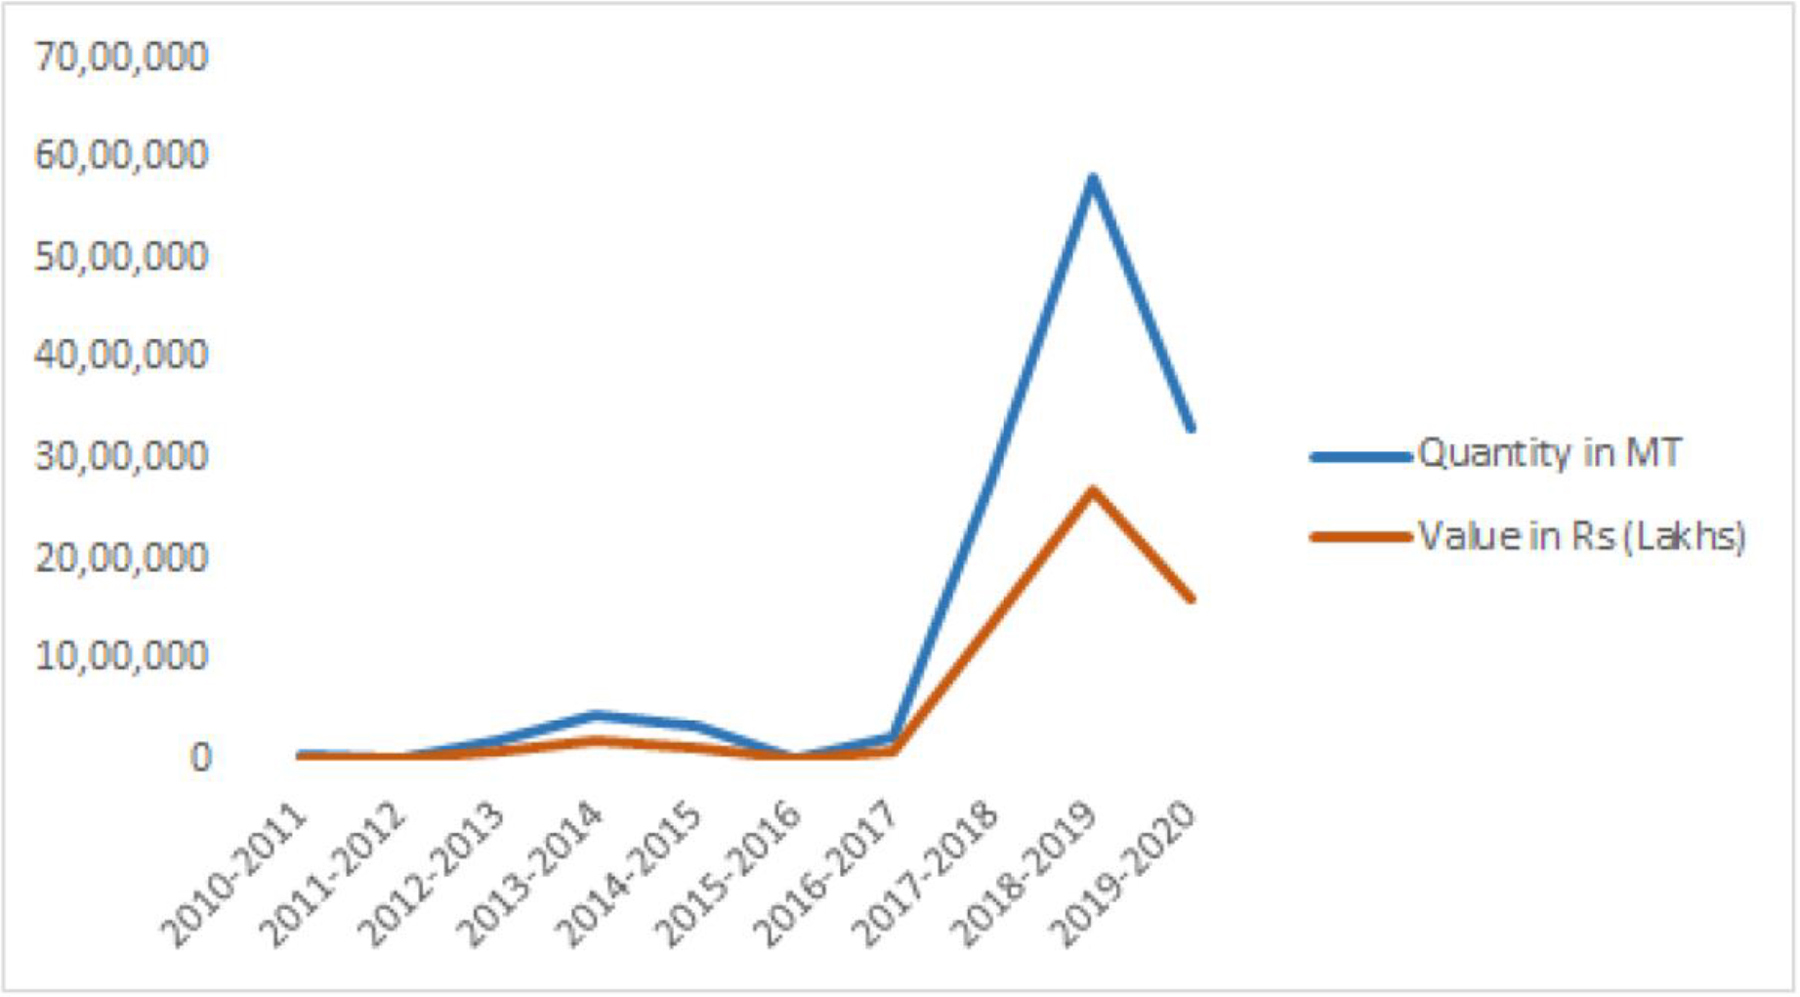
The horizontal axis shows the years from 2010–2011 to 2019–2020 and the vertical axis shows the values from 0 to 70,00,000 in increments of 10,00,000. Approximate data corresponding to procurement of Oil Seeds and Pulses by NAFED over years is as follows:
Value in rupees (Lakhs): 2010–2011: 0; 2011–2012: 0; 2012–2013: 2500; 2013–2014: 5000; 2014–2015: 2500; 2015–2016: 0; 2016–2017: 2500; 2017–2018: 15,00,000; 2018–2019: 28,50,000; 2019–2020: 18,00,000.
Quantity in MT: 2010–2011: 0; 2011–2012: 0; 2012–2013: 10,000; 2013–2014: 40,000; 2014–2015: 30,000; 2015–2016: 0; 2016–2017: 10,000; 2017–2018: 32,50,000; 2018–2019: 58,00,000; 2019–2020: 33,25,000
Exhibit 6: MSP Based Procurement by NAFED - Year Wise Procurement of Oil Seeds and Pulses by NAFED
Source: The data was taken from “Evaluation Report on Efficacy of Minimum Support Prices (MSP) on farmers” by Niti Aayog (2016)23
| Exhibit 7 Summary of Aggois’ Field Pilots | ||||
|---|---|---|---|---|
# | Information | Pilot 1 | Pilot 2 | Pilot 3 |
1 | District | Gulbarga | Gulbarga | Gulbarga |
2 | Number of villages | 2 | 9 | 20 |
3 | Number of PACS | 2 | 6 | 11 |
7 | Name of NBFC partner | Microgram | Any Time Loan (ATL) | Kudos finance |
8 | Number of farmers applications collected | 28 | 50 | 200 |
9 | Number of mandates approved | 20 | 35 | 80 |
10 | Name of crop | Tuar | Moong | Tuar |
11 | Sowing time (month, year) | June, 2018 | June, 2019 | June, 2019 |
12 | Harvest time (month, year) | December, 2018 | Sept, 2019 | December, 2019 |
13 | Loan disbursal period (month, year - month, year) | April 2019 (4 beneficiary), May 2019 (1 beneficiary) | November 2019 (35 beneficiaries) | March 2020 (34 beneficiaries), April 2020 (6 beneficiaries) |
14 | Total loan disbursed (INR) | INR 1,52,500 (30,500 per ticket) | INR 7,90,676 | INR 14,73,000 (37,000 per ticket) |
15 | Loan recovery period (month, year - month, year) | May 2019 (4 beneficiaries), July 2019 (1 beneficiary) | Dec 2019 (4 beneficiaries), Jan 2019 (28 beneficiaries) February 2020 (2 beneficiaries) March 2020 (1 beneficiary) | April 2020 (30 beneficiaries), May 2020 (5 beneficiaries), June 2020 (3 beneficiaries) |
16 | Total loan recovered (INR) | INR 1,55,739 | INR 15,11,893 | |
The flowchart is described as follows:
Rural Cooperative Credit Institutions (94, 384) is categorized into several institutions based on credit type: Short term credit and long term credit.
Of the 93,770 institutions that provide Short Term Credit 33 are State Central Cooperative Bank; 37 are District Central Cooperative Bank (370) and 93,367 are Primary Agriculture Credit Society.
Of the 614 institutions that provide Long Term Credit, 13 are State/Central Cooperative Agricultural Rural Development bank and 601 are Primary Cooperative Agricultural Rural Development bank.
Exhibit 8: The Structure of Cooperative Credit Institutions in India
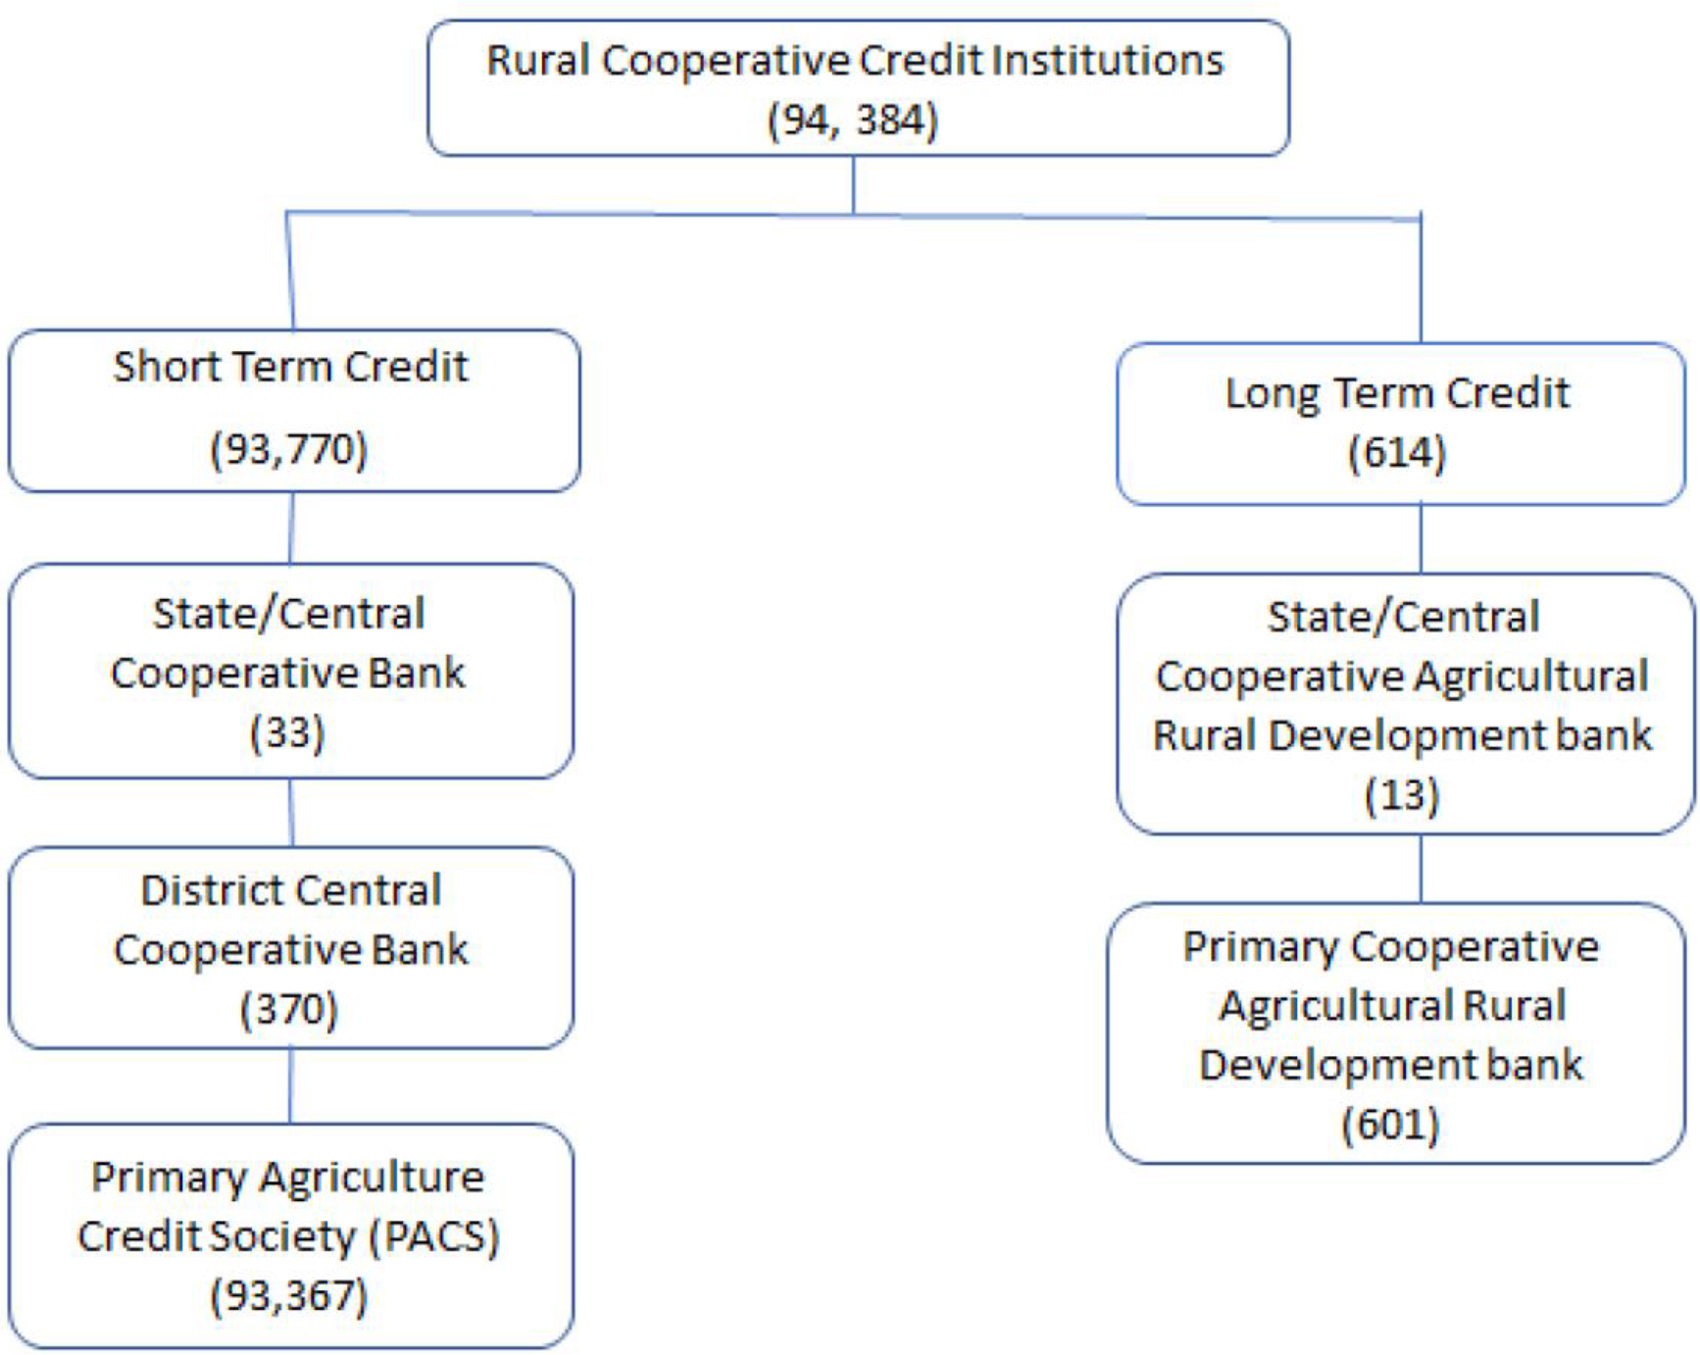
- Short Term Credit: This refers to the short-term crop loans and working capital needs of the farmers. The apex is the State Cooperative Bank, and its members comprise the units at the intermediate level that are the District Central Cooperative Banks (DCCBs). DCCBs membership further comprises grassroot (or village) level units that are the Primary Agriculture Credit Society (PACS). PACS comprises village farmers, and engages in (a) deposit mobilization and loan provision through the farmer members and (b) borrowing from the higher tier credit organisations (DCCBs, StCBs). PACS is the grassroot level institution, currently numbered at 93,367 across the country and comprising an asset size of 22% of the total corpus of rural cooperative credit. For the four years between 2012–13 and 2014–15, the PACS in profit exceeded the PACS in losses by 4–8%.24
- Long Term Credit: This refers to medium-long term loans for investments in the agricultural sector such as land development, farm mechanisation, irrigation, rural industries. At the state level, there is State Cooperative Agricultural and Rural Development Bank (SCARDBs) and at the district/block level, there is Primary Cooperative Agricultural and Rural Development Banks (PCARD), numbered at 13 and 601 respectively.25
The vertical axis shows percentage values from 0 to 60 in increments of 20. Approximate data corresponding to the percentage of farmers receiving MSP payments by time is as follows: Day of sale: 20 percent; Within 2 to 3 days of sale: 5 percent; After one week: 50 percent; After one month: 3 percent.
Exhibit 9: Average Timing of MSP Payments to Farmers
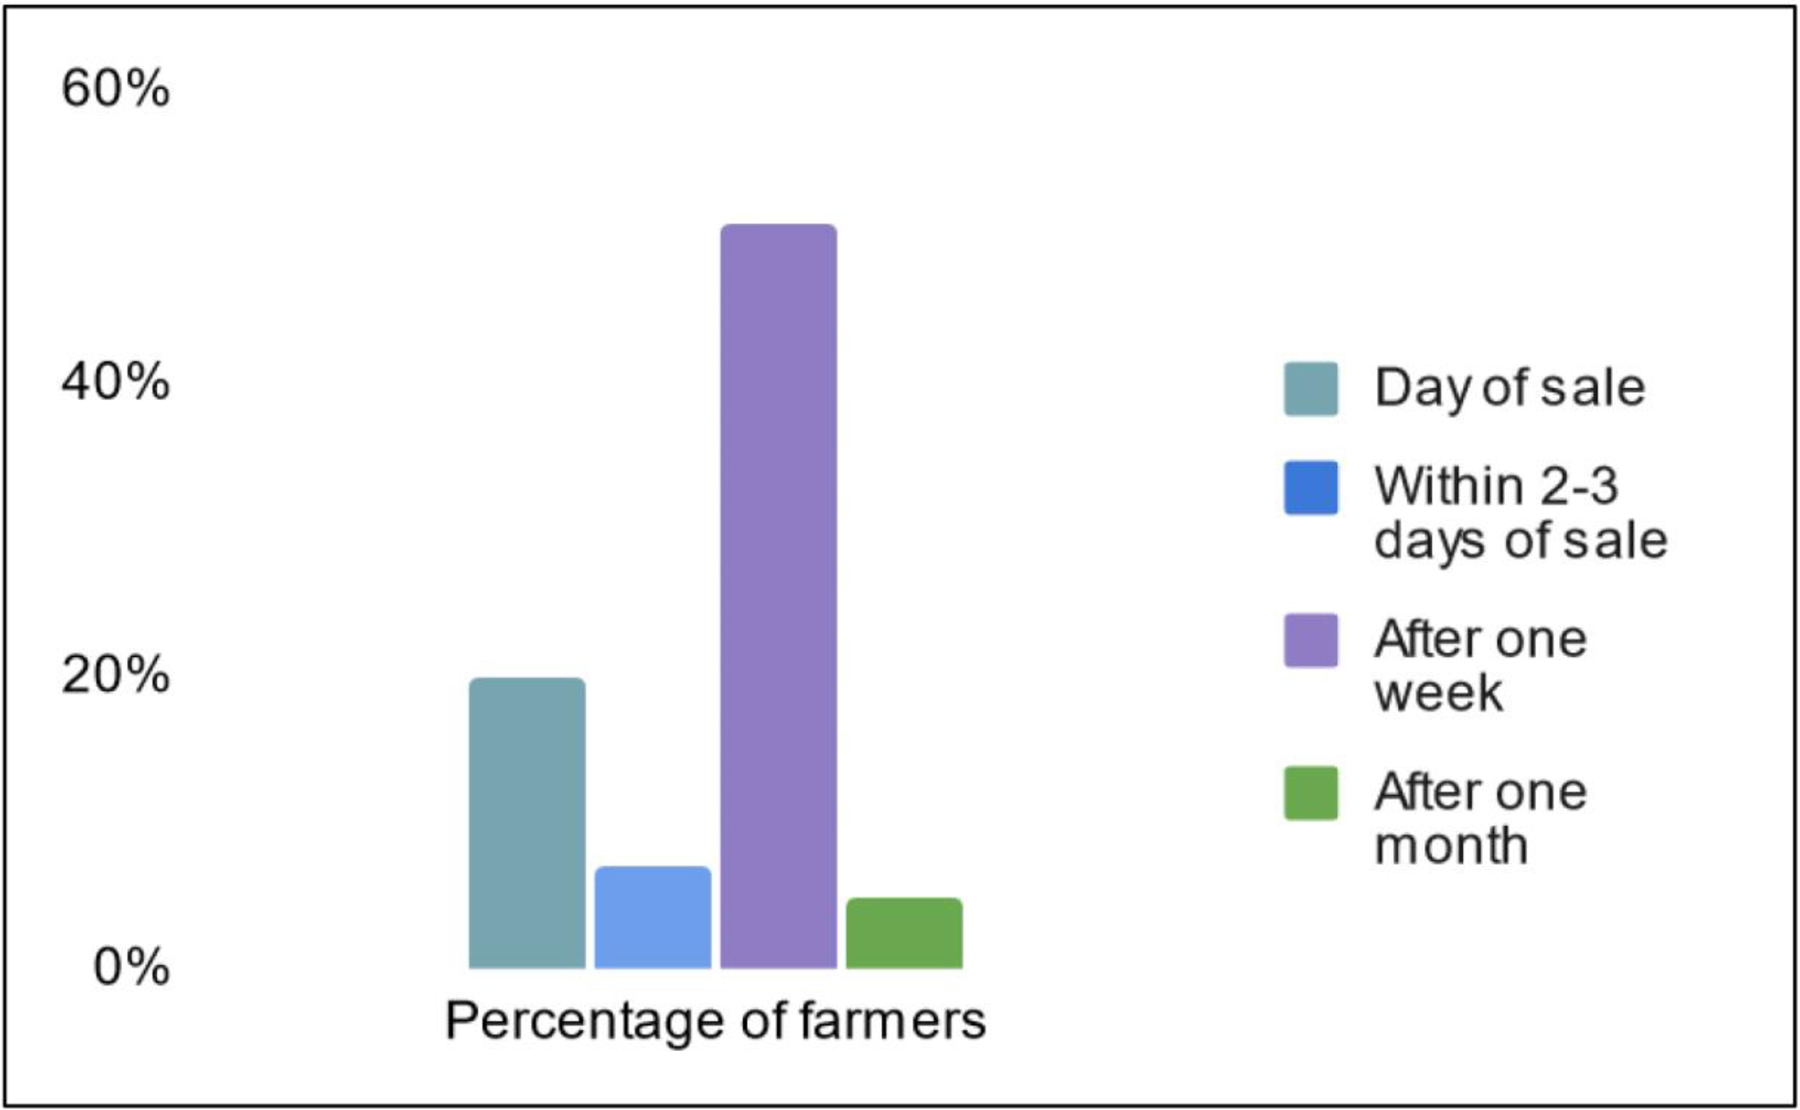
Source: The data is taken from “Evaluation Report on Efficacy of Minimum Support Prices (MSP) on farmers” by Niti Aayog (2016). The findings are based on sample of 14 states for reference period (2007–08 to 2010–11) collected by NITI Aayog (2016)26
Notes
1 I.e. 1000 kgs (1 quintal equals 100 kg).
2 The English name for tur dal is split pigeon peas.
3 The concept of MSP is explained in detail in the next section.
5 The location (Gulbarga) was in close proximity with the team’s work presence and they had developed strong ground level connections, and this was the primary motivation for its selection during the pilot.
6 Based on field reports, local money lenders rates were anywhere between 24% and 48% on an annualized basis. These loans are typically taken during cultivation time and paid back post-harvest or sale of produce, which usually takes 4–8 months.
7 Two major categories of financing in agriculture are internal and external value chain financing. The former includes aggregator credit, input supplier, marketing company credit, lead firm financing, warehouse receipt financing. The latter includes regular finance, receivable finance, physical asset collateralization, risk mitigation products, financial enhancements.
(Reference- Swamy, V., & Dharani, M. (2016). Analyzing the agricultural value chain financing: approaches and tools in India. Agricultural Finance Review.)
8 Dev, S. M., & Rao, N. C. (2010). Agricultural price policy, farm profitability and food security. Economic and Political Weekly, 174–182.
9 Gulati, A. (1980). Agricultural Price Policy in India. Concept Publishing Company.
10 Ibid
11 Dev, S. M., & Rao, N. C. (2010). Agricultural price policy, farm profitability and food security. Economic and Political Weekly, 174–182
12 Niti Aayog (2016). Evaluation Report on Efficacy of Minimum Support Prices (MSP) on farmers. Retrieved from https://niti.gov.in/writereaddata/files/writereaddata/files/document_publication/MSP-report.pdf
13 Ibid
14 The latter is arrived based on (average produce per acre) * (eligible land size under MSP). The key decisions are made by NAFED (Ministry of Agriculture, Central govt), state nodal agencies (e.g., MARKFED & Pulses Board in Karnataka) in consultation with local DC office (district collector)
15 (Trade) receivables financing is an instrument, wherein, a bank or other financier advances working capital to agribusiness against the account receivables or confirmed orders to producers. (Source: Soundarrajan, P., & Vivek, N. (2015). A study on the agricultural value chain financing in India. Agricultural Economics, 61(1), 31–38,
16 Pavati means receipt.
17 Common reasons for rejections included: signature/thumb impression mismatches, bank does not support NACH
18 The partnership was formed with the expectation that the rates would be revised. However, Aggois decided to move on based on their working relationship with
19 Application programming interface (API) enables organizations to open their data and functionality to external third-party or business partners. This allows communication between different services and products, and also leveraging each other’s data and functionality through a documented interface. Source: IBM Cloud Education (2020, August 19). Retrieved from https://www.ibm.com/cloud/learn/api
20 FE Bureau (2021) Prices fall below MSP; pulses procurement to begin soon. Financial Express. Retrieved from https://www.financialexpress.com/market/commodities/prices-fall-below-msp-pulses-procurement-to-begin-soon/2168970/, Singh, S. (2020) Bihar procurement at snail’s pace, farmers forced to sell paddy much below MSP. The Indian Express. Retrieved from https://indianexpress.com/article/india/bihar-procurement-at-snails-pace-farmers-forced-to-sell-paddy-much-below-msp-7093413/
23https://niti.gov.in/writereaddata/files/writereaddata/files/document_publication/MSP-report.pdf, http://www.nafed-india.com/documents/AR.pdf
24 Reserve Bank of India (2017) Developments in Co-operative Banking. Retrieved from https://rbi.org.in/Scripts/PublicationsView.aspx?id=18062
25 Ibid
This case study is provided in this Sage Business collection primarily as a basis for classroom discussion or self-study and is not meant to illustrate either effective or ineffective management styles. Nothing herein shall be deemed to be an endorsement of any kind. This case study is for scholarly, educational, or personal use only within your university, and cannot be forwarded outside the university or used for other commercial purposes.
© 2026 Sage Publications, Inc. All Rights Reserved.
Get a 30 day FREE TRIAL
-
 Watch videos from a variety of sources bringing classroom topics to life
 -
Read modern, diverse business cases
-
Explore hundreds of books and reference titles

Read next

More like this
Sage Recommends
We found other relevant content for you on other Sage platforms.
Have you created a personal profile? Login or create a profile so that you can save clips, playlists and searches