Entry
Reader's guide
Entries A-Z
Subject index
T Scores
Tell me and I'll forget; show me and I may remember; involve me and I'll understand.
T scores are area-normalized scores standardized to have a mean of 50 and a standard deviation of 10. They are like normally distributed z scores except that they have been subjected to a linear transformation that changes the mean of the distribution from zero to 50 and changes the standard deviation from1.0 to 10. As a result, T scores are always positive, usually ranging from about 20 to 80, although more extreme values are possible. Ordinarily, T scores are reported without a decimal point; that is, they are rounded to whole numbers (48.4 becomes 48, 48.6 becomes 49).
T scores were first described by McCall and named in honor of three famous psychologists of the era whose last names began with T. Since that time, T scores have provided the metric for a number of psychological and educational tests. Although McCall defined T scores as being normalized, thereby giving them many of the advantages of normal-curve z scores without some of the disadvantages, subsequent users have often failed to incorporate the normalization step and have simply transformed ordinary z scores into a scale with a mean of 50 and a standard deviation (SD) of 10 and called them T scores. Thus, when T scores are mentioned as a metric for a test, it is important to determine whether the normalization step has been taken.
Properly constructed T scores cannot be computed directly from the raw scores unless the raw scores are themselves normally distributed. This is because any linear transformation, such as computing z scores, does not change the shape of the original distribution. If the raw score distribution is positively skewed, the z scores and any transformations of those z scores will also be positively skewed to the same degree.
The determination of area-normalized scores requires the use of a table of the normal distribution such as is found in almost any statistics book and some measurement texts, and it always involves as a first step the determination of normalized z scores. The process is as follows: Make a frequency distribution and cumulative frequency distribution of the raw scores.
Determine the percentile rank of each raw score. The formula is
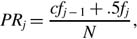
where
- PRj is the percentile rank of raw score j,
- cfj−1 is the cumulative frequency for the next lower raw score,
- .5 fj is half of the frequency for raw score j,
- N is the total number of cases.
Once the percentile ranks have been determined, look up the z score that has the corresponding percentile rank.
- For percentile ranks less than 50, this will be the negative z score, which has an area beyond itself equal to the percentile rank. For example, if the percentile rank of a raw score is 16, the z score that has 16% of the distribution below it is −1.00.
- For percentile ranks greater than 50, subtract 50 from the PR and look up the z score that has the remaining percentage between itself and the mean. For example, if the percentile rank of a raw score is 84, we would look up the z score that has 34% of the distribution between itself and the mean. This z score is + 1.00. (Occasionally, you may find a table of the cumulative normal distribution in which the relationship between percentile ranks and z scores can be read directly.)
You now have a set of z scores that has been forced into a normal distribution by being assigned values corresponding to the percentile ranks of the normal distribution. To obtain T scores, multiply each z score by 10, then add 50. That
...
- Classroom Achievement
- Acceleration
- Alternative Academic Assessment
- Bell Curve
- Direct Instruction
- Educational Technology
- Failure, Effects of
- Gifted and Talented Students
- Goals
- Grade Retention
- Grading
- Halo Effect
- Home Environment and Academic Intrinsic Motivation
- Homework
- Intelligence and Intellectual Development
- Intelligence Quotient (IQ)
- Intelligence Tests
- Literacy
- Media Literacy
- Parental Expectations
- Personalized System of Instruction
- Precision Teaching
- Reading Comprehension Strategies
- Rubrics
- Spelling
- Test Anxiety
- Classroom Management
- Calculator Use
- Cheating
- Contingency Contracts
- Cooperative Learning
- Curriculum Development
- Discovery Learning
- Distance Learning
- Early Intervention Programs
- Educational Technology
- Effective Teaching, Characteristics of
- Mainstreaming
- Montessori Schools
- School Design
- School Resources
- Students' Rights
- Time-Out
- Token Reinforcement Programs
- Virtual Schools
- Vocational Education
- Cognitive Development
- Cognitive Development and School Readiness
- Conservation
- Deductive Reasoning
- Egocentrism
- Equilibration
- Field Independence–Field Dependence
- Flashbulb Memories, the Nature of
- Inductive Reasoning
- Intelligence and Intellectual Development
- Literacy
- Long-Term Memory
- Measurement and Cognitive Development
- Metacognition and Learning
- Moral Development
- Motivation and Emotion
- Object Permanence
- Perceptual Development
- Piaget's Theory of Cognitive Development
- Schemas
- Short-Term Memory
- Spelling
- Vygotsky's Cultural-Historical Theory of Development
- Zone of Proximal Development
- Ethnicity, Race, and Culture
- African Americans
- American Indians and Alaska Natives
- Asian Americans
- Bilingual Education
- Bilingualism
- Communication Disorders
- Cultural Deficit Model
- Cultural Diversity
- Culture
- Diversity
- Ethnicity and Race
- Head Start
- Hispanic Americans
- Identity Development
- Immigration
- Multicultural Classrooms
- Multicultural Education
- Families
- Gender and Gender Development
- Health and Well-Being
- Abstinence Education
- Athletics
- Attention Deficit Hyperactivity Disorder
- Autism Spectrum Disorders
- Behavior Disorders
- Brain-Relevant Education
- Communication Disorders
- Conduct Disorders
- Diagnostic and Statistical Manual of Mental Disorders
- Disabilities
- Drug Abuse
- Dyslexia
- Eating Disorders
- Extracurricular Activities
- HIV/AIDS
- Learning Disabilities
- Malnutrition and Development
- Mental Health Care in Schools
- Mental Retardation
- Obesity
- School Counseling
- Sex Education
- Special Education
- Suicide
- Human Development
- Acculturation
- Aggression
- Androgyny
- Anxiety
- Aptitude
- Athletics
- Attachment
- Attachment Disorder
- Autism Spectrum Disorders
- Behavior Disorders
- Creativity
- Early Intervention Programs
- Egocentrism
- Emotion and Memory
- Emotional Development
- Empathy
- Equilibration
- Erikson's Theory of Psychosocial Development
- Extracurricular Activities
- Friendship
- Gifted and Talented Students
- Head Start
- Identity Development
- Individual Differences
- Individuals with Disabilities Education Act
- Intelligence and Intellectual Development
- Intrinsic versus Extrinsic Motivation
- Kohlberg's Stages of Moral Development
- Mainstreaming
- Maslow's Hierarchy of Basic Needs
- Maturation
- Mental Retardation
- Metacognition and Learning
- Moral Development
- Motivation
- Motivation and Emotion
- Motor Development
- Myelination
- Neuroscience
- Peer Influences
- Perceptual Development
- Physical Development
- Piaget's Theory of Cognitive Development
- Risk Factors and Development
- School Violence and Disruption
- Self-Determination
- Self-Efficacy
- Self-Esteem
- Special Education
- Test Anxiety
- Vygotsky's Cultural-Historical Theory of Development
- Intelligence and Intellectual Development
- Language Development
- Learning and Memory
- Adult Learning
- Assistive Technology
- Aversive Stimuli
- Behavior Modification
- Bloom's Taxonomy of Educational Objectives
- Brain-Relevant Education
- Classical Conditioning
- Cognitive and Cultural Styles
- Cognitive View of Learning
- Cooperative Learning
- Discovery Learning
- Discrimination
- Distance Learning
- Divergent Thinking
- Educational Technology
- Emotion and Memory
- Episodic Memory
- Explicit Memory
- Flashbulb Memories, the Nature of
- Habituation
- Intrinsic versus Extrinsic Motivation
- Learning
- Learning Communities
- Learning Disabilities
- Learning Strategies
- Learning Style
- Lifelong Learning
- Long-Term Memory
- Malnutrition and Development
- Maturation
- Memory
- Metacognition and Learning
- Mnemonics
- Motivation and Emotion
- Observational Learning
- Older Learners
- Operant Conditioning
- Peer-Assisted Learning
- Perceptual Development
- Premack Principle
- Reinforcement
- Rosenthal Effect
- Shaping
- Short-Term Memory
- Social Learning Theory
- Stimulus Control
- Working Memory
- Organizations
- Peers and Peer Influences
- Public Policy
- Abstinence Education
- Assistive Technology
- Bilingual Education
- Charter Schools
- Child Abuse
- Early Child Care and Education
- English as a Second Language
- Ethics and Research
- Gangs
- Grade Retention
- Head Start
- High-Stakes Testing
- Home Education
- Immigration
- Inclusion
- Individualized Education Program
- Individuals with Disabilities Education Act
- Institutional Review Boards
- Intelligence Tests
- Least Restrictive Placement
- Mainstreaming
- No Child Left Behind
- Poverty
- School Design
- School Violence and Disruption
- Sex Education
- Special Education
- Students' Rights
- Testing
- Tracking
- Vouchers
- Research Methods and Statistics
- T Scores
- Case Studies
- Confidence Interval
- Correlation
- Cross-Sectional Research
- Descriptive Statistics
- Ethics and Research
- Ethnography
- Experimental Design
- External Validity
- Field Experiments
- Frequency Distribution
- Generalizability Theory
- Inferential Statistics
- Internal Validity
- Longitudinal Research
- Mean
- Median
- Meta-Analysis
- Mode
- Naturalistic Observation
- Normal Curve
- Percentile Rank
- Qualitative Research Methods
- Quantitative Research Methods
- Random Sample
- Regression
- Scientific Method
- Standard Deviation and Variance
- Standard Scores
- Stanine Scores
- Statistical Significance
- Social Development
- Teaching
- Aptitude Tests
- Constructivism
- Contingency Contracts
- Criterion-Referenced Testing
- Curriculum Development
- Direct Instruction
- Educational Technology
- Effective Teaching, Characteristics of
- Emotion and Memory
- English as a Second Language
- Evaluation
- Expert Teachers
- Explicit Teaching
- Goals
- Grade Retention
- Grade-Equivalent Scores
- Grading
- Home Education
- Homework
- Instructional Objectives
- Learning Objectives
- Parent–Teacher Conferences
- Personalized System of Instruction
- PRAXIS™
- Precision Teaching
- Rubrics
- Scaffolding
- School Readiness
- Sex Education
- Students' Rights
- Teaching Strategies
- Tracking
- Testing, Measurement, and Evaluation
- Acceleration
- Alternative Academic Assessment
- Aptitude Tests
- Assessment
- Bell Curve
- Certification
- Criterion-Referenced Testing
- Essay Tests
- Evaluation
- External Validity
- Generalizability Theory
- Grade Retention
- Grade-Equivalent Scores
- Grading
- High-Stakes Testing
- Intelligence Tests
- Measurement
- Measurement of Cognitive Development
- Mental Age
- Multiple-Choice Tests
- Norm-Referenced Tests
- Percentile Rank
- Personality Tests
- Reliability
- Rubrics
- Standardized Tests
- Stanford–Binet Test
- Test Anxiety
- Testing
- Validity
- Theory
- Applied Behavior Analysis
- Behavior Modification
- Bloom's Taxonomy of Educational Objectives
- Classical Conditioning
- Cognitive Behavior Modification
- Cognitive View of Learning
- Constructivism
- Continuity and Discontinuity in Learning
- Cultural Deficit Model
- Dynamical Systems
- Erikson's Theory of Psychosocial Development
- Generalizability Theory
- Kohlberg's Stages of Moral Development
- Learned Helplessness
- Maslow's Hierarchy of Basic Needs
- Neuroscience
- Piaget's Theory of Cognitive Development
- Premack Principle
- Psychoanalytic Theory
- Psychosocial Development
- Reciprocal Determinism
- Rosenthal Effect
- Schemas
- Social Learning Theory
- Theory of Mind
- Vicarious Reinforcement
- Loading...
Get a 30 day FREE TRIAL
-
 Watch videos from a variety of sources bringing classroom topics to life
 -
Read modern, diverse business cases
-
Explore hundreds of books and reference titles

Read next

More like this
Sage Recommends
We found other relevant content for you on other Sage platforms.
Have you created a personal profile? Login or create a profile so that you can save clips, playlists and searches